1. SCOPE OF APPLICATION
In surfing on www.swotster.com or any website leading thereto (hereinafter the “Website”), consulting them or using them in any other way, you consent to the terms and conditions below and agree to abide by them. They alone apply, to the exclusion of all other terms and conditions.
If there are any of the terms and conditions in this document you do not agree with, do not use the Website any further.
We reserve the right to vary these terms and conditions at any time, and will inform you accordingly via the Website; but we recommend you to check the terms and conditions yourself regularly to see if they have changed. If there are any of the terms and conditions you do not agree with, do not use the Website any further; but, if you continue using the Website, you agree to the changes automatically.
2. THOSE RESPONSIBLE FOR THE WEBSITE
The responsible for the Website is SWOTSTER:
Swotster Ltd., Unit 1202, 12/F., Mirror Tower, 61 Mody Road, Tsim Sha Tsui East, Kowloon, Hong Kong;
All rights and interests invoked in these general terms and conditions are also invoked on behalf of other members of the SWOTSTER group and third parties SWOTSTER engages.
3. USE
The Website is a free service. It is provided for information purposes only. Your only right is to consult this Website and its content (the courses) for personal purposes and online only.
Any other use requires the written permission of SWOTSTER.
It is not allowed to print data/courses of the Website or to share the courses with third parties, even for free or for academic purposes.
Any commercial use of this Website is strictly prohibited. ‘Commercial use’ includes selling or hiring out data/courses on the Website, the different functionalities of the Website or memberships or registrations on the Website, or using the Website and its component parts with a view to generating advertising or subscription income or internet traffic. (This list is not exhaustive.) No information and/or component part of this Website may be stored in an (electronic) database or otherwise other than the information cached automatically by the browser.
It is strictly forbidden to use any technical means whatsoever to obtain access to parts not put publicly online. It is also strictly forbidden to amend or adapt the Website, add anything to and/or remove anything from it in anyway and by any technical means whatsoever except via resources SWOTSTER intends for the general public for that purpose. It is not allowed to remove or circumvent the digital rights management and protection mechanisms of the courses.
You agree not to do anything whatsoever, whatever the technical means used, which might prevent the Website from working properly at any time.
You must not use any (automatic) system, such as, but not limited to, ‘robots’, ‘spiders’, ‘offline readers’, etc., with the aim of creating access to the Website in such a way that more messages are sent to the Website or data obtained from the Website than anyone could achieve using a normal website browser normally (manually).
SWOTSTER allows public search engines to visit the content of the Website via ‘spiders’ etc. with the sole intention of making the content of the Website available via their search engines without SWOTSTER also granting the right to file the content of the Website thereby. SWOTSTER reserves the right to revoke the admission as formulated in this paragraph at any time.
Each link must refer to the home page of the Website. It is not allowed to deeplink to certain parts of the Website.
4. INTELLECTUAL PROPERTY RIGHTS
The courses, concept, content, layout, structure, source codes, software, images, photos, animations, audio-visual works, texts, data, products, trademarks, music and all other elements of the Website are and remain the exclusive property of SWOTSTER and its third party licensors, and are protected by various intellectual property rights (including copyright, trademark rights, the sui generis right of a database producer etc.), which you admit and accept. Surfing this Website does not confer any rights on you to it.
The Website and the information it contains or to which it refers are published for information only. Any reproduction, publication or other use is strictly forbidden. Applications to be allowed to reproduce the information found on the Website must be made to SWOTSTER’s webmaster.
5. LIABILITY
5.1 Data and courses
SWOTSTER tries to ensure that the data and courses put on the Website are complete, accurate and up to date, but does not give any warranty in that respect. The data and courses are intended for a wide audience, and may include information which does not apply or is not valid in your situation. The data and courses may not be in accordance with best practices; and errors and/or omissions and/or out of date data can never be ruled out, and SWOTSTER cannot give any guarantees in that respect whatsoever. Users ecognise that the data and courses on the Website are purely by way of information only, and must be verified with specialists in the field. The courses are intended to increase your general knowledge on a subject matter and not as advise in a specific matter. SWOTSTER cannot accept any liability whatsoever for any damage and/or loss of any kind whatsoever which may arise as a result of using, consulting and/or downloading any course. Nor can SWOTSTER accept any liability for any losses of any kind arising as a result of decisions you may take based on the courses or other content on the Website. SWOTSTER may also vary the courses or data published on the Website at any time.
5.2 Accessibility
The Website can be consulted by recent computers using current software (browser, operating system, etc.); but SWOTSTER does not guarantee compatibility in any way and cannot under any circumstances be held liable should you be unable to consult and/or use the Website in any way, wholly or in part.
SWOTSTER makes every effort to ensure that the Website is accessible to a normal number of users at any time, but may suspend or discontinue this Website, wholly or in part, at any time, even without prior warning. SWOTSTER cannot be held liable for any loss and/or damage of any kind whatsoever which may be incurred as a result of any suspension, interruption, (technical) problems, delays, access problems, inaccessibility and/or terminating the Website or any part of it.
5.3 Links
The Website may contain links to other sites. The only purpose of links to other websites is to make consulting the Website easier. If there are links to other websites, that does not in any way mean that SWOTSTER approves the content of those third party websites. SWOTSTER cannot be held liable in any way by reason of any third party website, its contents or how they are exploited. SWOTSTER’s privacy policy does not apply to these websites.
5.4 Viruses
Although SWOTSTER tries to keep the Website free of bugs, viruses, Trojan horses and spyware, it cannot be ruled out that these may still occur nonetheless. SWOTSTER cannot be held liable for any resulting damage and/or loss. You must always have the firewall, anti-virus and other security software installed to prevent your computer possibly being damaged. Should you find any of the elements above on the Website, you must inform the webmaster so the necessary action can be taken.
5.5 Message
All kinds of messages (posts, tips, links, messages, responses, communications etc.) may appear on the Website from third parties. Third parties post such messages without SWOTSTER checking them out first. As such messages are the work of third parties, SWOTSTER cannot accept any liability whatsoever for any losses which may result from them or for any errors in their content. Any and all texts, photos, videos, messages or other materials included in such messages are the sole responsibility of the person from whom that data emanates. Should you believe such messages infringe your rights or are detrimental to you otherwise, you can contact us.
6. REGISTRATION
You need to register to be able to access or use certain parts of the Website. You must enter correct data. Keep your login and password secret and do not share them with any third parties. Each registered user is responsible for his or her registration or membership and any misuse or injury arising therefrom themselves. SWOTSTER is not liable for any improper use of your registration or membership, login and/or password.
7. PRIVACY The Website treats your personal data in accordance with this policy and with current rules and regulations in force. This policy applies to personal data gathered via SWOTSTER’s online sources, such as websites, email and other online tools.
SWOTSTER only gathers your personal data if you allow SWOTSTER to access it. SWOTSTER will not share or sell your personal data with third parties for marketing purposes on their own account unless you expressly agree to it.
If you decide to disclose your personal data, you have the right to consult and correct your data at any time by logging into the Website. Your consent may be asked to using your data for certain purposes: you can consent or refuse. If you opt for specific services or communications, such as an e-newsletter, you can deregister at any time by following the instructions stated in each communication. If you decide to deregister from a service or communication, SWOTSTER will delete your data as soon as possible.
SWOTSTER uses technologies and security precautions, rules and other procedures to protect your personal data against being accessed without authority, misused, disclosed, lost or destroyed. To ensure your data remains confidential, SWOTSTER also uses standard firewalls and passwords; but you yourself must verify that the computer you are using is adequately protected against malware such as Trojans and viruses.
It may be you are given the option on the Website to send a link or message referring to a SWOTSTER website to a friend or colleague. The email addresses you give for this purpose will be used to send the information to your friend or colleague in your name, and will not be gathered or used for other purposes by SWOTSTER or by third parties.
SWOTSTER may review its online policy on protecting personal privacy at any time. Such modifications will be announced on the Website. In continuing to use the Website once you have been informed of changes to the policy on protecting personal privacy, you agree to us using all new data furnished in accordance with SWOTSTER’s modified policy on protecting personal privacy.
Should you have any questions, or if you want SWOTSTER to correct or delete your profile, please send a letter to the address stated in Article 2.
8. COOKIES
SWOTSTER makes use of cookies on the Website in order to improve the user experience. A cookie is a small text file that is stored on your computer. Cookies enable SWOTSTER to save information on the server that facilitates your visit of the Website and that allows SWOTSTER to analyse the Website and the performance thereof.
The cookies used on the Website are:
1. theUserName
2. thePwd
These cookies are created in the login module when the user selects the ‘remember me’ option. A cookie has a (unique) value. It doesn’t contain any personal data. SWOTSTER doesn’t use cookies to identify you directly or via third party services. SWOTSTER uses Google Analytics, a web analytics service provided by Google, Inc. (“Google”). Google Analytics uses cookies for the purpose of evaluating your use of the Website, compiling reports on website activity and providing other services relating to website activity and internet usage. For more information on these cookies, see https://developers.google.com/analytics/devguides/collection/analyticsjs/cookie-usage.
In case you object to the use of cookies by the Website, you can configure your browser to receive a message that a cookie is placed or to disable cookies. The effect thereof may be that you cannot use all functionalities of the Website or that the Website doesn’t function optimally.
9. MISCELLANEOUS
9.1 Invalidity
The provisions of these terms and conditions of use are severable. Therefore, should any of the provisions be declared invalid, this will not affect the validity of the other provisions in any way. Should any of these terms and conditions of use be declared excessively broad, that provision will be enforceable to the maximum the law allows nonetheless. Should any part of these terms and conditions be considered totally invalid, the parties will replace it in good faith by a provision which comes as close to the financial effects of the provision declared invalid as possible.
9.2 Governing law and jurisdiction
Any dispute of any kind whatsoever arising out of consulting and/or using the Website will be governed by Belgian law, and will be subject to the exclusive jurisdiction of the Courts and Tribunals of Brussels, Belgium.
9.3 Notices and contact
You accept expressly that any and all notices from SWOTSTER to you may be duly made via the e-mail address you gave to SWOTSTER and/or with general notices by being notified via the Website. Such notification will be made in English or Dutch.
If you have any queries concerning these terms and conditions, you can get in touch with SWOTSTER at the addresses as stated in Article 2 at any time.
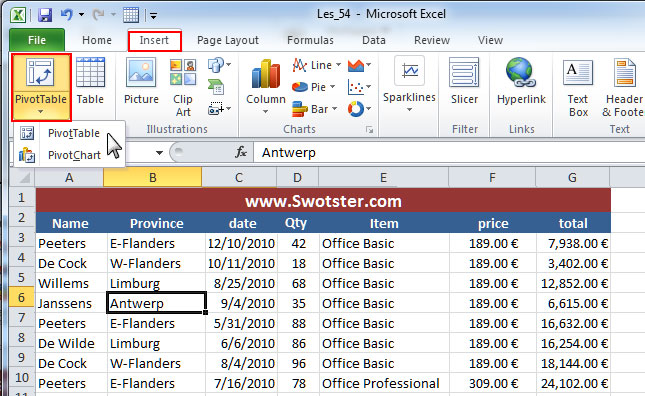
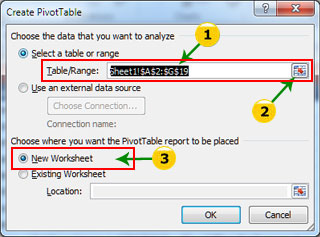 first selected a cell in our table. If we had not done this, or if you still have to change the “Range”, click the “Folding” (2) button.